Wednesday, February 22, 2023

Orion's Impact?

There is exciting news from Dr. Phil Stooke about Orion, the Apollo 16 Lunar Module Ascent Stage. I’ll discuss it more below, but first I’ll share some additional simulation results for Orion.

This post showed that by concentrating simulations on the last known inclination of Apollo 16, all the resulting impacts are in a small area of the Moon, around 6 km on a side. That was a surprising and exciting result, but the database of impact points was rather small. Out of the original 350 impacts I had simulated, only 28 were within the tighter (+/-0.5°) inclination range. So, I have generated a lot more simulations within that range.

From my original parameter set, I “squeezed” the initial azimuth variation into the range of interest, keeping all the other parameters the same. (Actually, I generated entirely new set of random azimuth values in the narrowed range, rather than compressing the old values.) Then I had to go through another round of nudging of these parameter sets to coax the impact times towards the right value, as defined by the seismic signal which seems to have been generated by the stage impact. What’s the result? All but one of the simulated impacts are within the same small area defined by the earlier set. The figure below shows how it looks. Each blue dot is one impact point. Everything is centered on 104.3° E and 10.0° N, within about +/- 0.1° in both directions. I’ve uploaded the data to GitHub as a csv file if you want to check it yourself.

Figure 1: More simulated impact points for the Orion Lunar Module 

With the additional data points, patterns in the data start to be clearer. The impact points are generally concentrated along a band that runs from the SW to NE. Why is that? You might think that the orbital paths are running along this track, but it isn’t true. All the ground tracks are very close to due West, and I added the black "Heading Angle" arrow in the upper right corner as an example. In fact, the banding of the impacts is a reflection of terrain contours in this area. I included the red contour lines (at 250 meter intervals) in the plot of figure 1, and it’s clear that the ridge where these impacts strike the Moon is running SW to NE. (The ridge is the rim of a nearby crater. This link takes you to a view of the Moon that I used as the background for the plot, so that you can zoom out and see what else is in the neighborhood.)

Now for the exciting news. In the middle of the area where all these simulations strike the Moon, Dr. Phil Stooke has located a candidate structure showing the hallmarks of a Lunar Module impact! Dr. Stooke has previously located several other LM impact sites and is expert in processing and enhancing images of the Moon from NASA and other sources. In particular one of his best tricks is to combine images taken with low Sun angle from East and West, so that he can eliminate the shadows of the craters, and then enhance the contrast on the remaining features. Using this technique, he happened upon a characteristic V-shaped feature, which is very similar to other LM impacts that he has identified. The figure below is one of the images he has enhanced, and you see an East-West gouge with a V-shaped rays emanating Westward.  It is located at 9.99° N, 104.26° E, as indicated by the green rectangle in Figure 1. Unfortunately, the available images of this site from the Lunar Reconnaissance Orbiter (LRO) are lower resolution than other parts of the Moon that NASA has studied more closely. Also, the main impact crater is oriented East-West, so it never gets shaded as the Sun moves across the lunar sky, making it hard to see its extent clearly. 

Figure 2 is one of the enhanced images Dr. Stooke shared with me, which he produced using his shadow-cancelling flow.

Figure 2: Combined images showing an East-West gouge with a V-shaped fan emanating westward. Could this be the location where Orion struck the Moon?

Until better images are available, we can only count this location as a candidate for Orion’s final impact site. Meanwhile, this work will be presented in a poster session at the 2023 Lunar and Planetary Science Conference in Houston on March 15th, so the scientific community will have a chance to weigh in. My thanks to Dr. Stooke for submitting the abstract, putting the poster together, and basically doing all the legwork to present this result. I hope someday one of the still-operating lunar imagers, or perhaps a future one, can be used to examine this location in greater detail. 


Tuesday, May 24, 2022

Impact Phase

 As I mentioned in my previous post, I have generated over 350 parameter sets that strike the Moon within one hour of the May 29th seismic event that seems to record the final impact of the ascent stage of the Apollo 16 Lunar Module Orion. Are all of these useful? What time difference should disqualify a simulation? If the simulation misses by 5 minutes, is that OK? If it misses by a full hour, is it meaningless? To answer this question, we need to dig deeper into the data, to try to understand what’s behind the time shifts. 


Let’s start with Figure 1, which is showing the distribution of impact times. Each vertical bar represents one 4-minute period, and the height of the bar shows how many of the simulations strike the Moon within that period. The red bar near the middle of the graph is the target time, around 21:14 on May 29th, 1972. The height of that bar is 30, meaning that 30 of the simulations impact within that 4-minute window. Overall, this set is centered about 6 minutes later on 21:20, and the impacts cover a total time span of 90 minutes. 

Figure1: Distribution of impact times from my simulation set. The red bar is at the time of the recorded impact event, and 30 of the simulations strike the Moon within that 4-minute window.

If you read my earlier post about “nudging” the orbits closer to a target impact time, you might be wondering…why not continue nudging until all the impacts occur at exactly the right time? The reason is that nudging stops working once you get the impact within one orbital period of the target. Huh? Let’s say the period is exactly 2 hours. (It’s close to that.) And let’s say we have a case where the impact is early by 2 hours and 20 minutes. We nudge the VMAG parameter a bit higher and re-run the simulation. Sure enough, this time Orion skims over the impact point, and zooms around for an extra revolution…then slams into the Moon two hours later on its next pass. Now, instead of being 2:20 early, it’s just 20 minutes early. Unfortunately, further nudging barely affects the 20-minute miss. In fact, another nudge might push the impact out by another 2 hours, making things worse.

We need to work with the impact times we have. Maybe we can understand what’s driving those offsets in the impact times? Let's call it impact phase. Once again (as has happened over and over during this investigation) the answer becomes obvious once the data is viewed in the right way. Take a look at Figure 2, which compares the “miss” time, in minutes, versus the initial orbit period in seconds. Aha! Notice that a one second increase in the orbit period shifts the impact time by about 7.2 minutes…or about 430 seconds. If Orion struck the Moon on May 29th, it would have been on about the 435th revolution around the Moon since jettison. So, a one second increase in the period means that 435 revolutions later, it has fallen behind by 435 seconds. And that is exactly what we see in Figure 2. Slower orbits mean later impacts, and vice versa. Impact phase is controlled by the orbit period.

Figure 2: Time offsets from the target vary linearly with the orbital period. It makes perfect sense!

(Another very interesting thing about Figure 2 is that it gives us a great way to validate that the May 29th seismic event was actually Orion. If we knew exactly the orbital period of Orion, we could confirm that it lines up with the observed impact time. I have looked for sources that could confirm Orion’s orbital period without success. Do you have any references? Please leave a comment.)

But now let’s get back to the original question. If a given simulation misses the impact time, can it still be useful to predict the impact location? One way to answer this is to take a given parameter set, and tweak it so as to vary its period, shifting the impact time, and then take a look at how the impact location moves around. Dramatic position shifts would mean we should ignore those simulations that aren’t close to the right time. Modest shifts would indicate that the exact time of impact is not so critical.

Figure 3: A sweep of one parameter set, to vary the impact time. Although the impacts are spread over a range of 2-plus hours, the impact locations are all within 1.4 km of each other. 

One way to change the orbital period is to raise the orbit, so that is what I’ve done in a set of simulations shown in Figure 3. You see that the RMAG parameter (the distance from the center of the Moon) is gradually raised to 1849.2 km. The VMAG parameter has been “nudged” to bring the impacts within one orbit of the target time, while all other parameters are held constant. Notice the impact locations. They remain in a tight pattern centered around 104.3 °E, near 10 °N. These locations are all within 1.4 km of each other, despite the fact that the impact times go from 84 minutes before the target to 53 minutes after. 

From this, I conclude that I need not be too concerned about impact time shifts of less than one orbit. The full database of impact locations seems to be useful as an indicator of where Orion’s remains can be found.


Saturday, May 14, 2022

Orion's Impact Area


In a recent post I showed that one event in the seismic catalog of the Moon seems to have recorded the impact of the Apollo 16 Lunar Module “Orion”. This event occurred late on May 29th, 1972, about five weeks after Orion was jettisoned. Then in my last post I described a way to “nudge” the initial conditions of a simulation in order to move the impact date/time towards the time of this event. Using this nudging technique, I have been able to generate several hundred simulations, all random variants of the nominal orbit of Orion, all of which impact the Moon within an hour of the target event at around 21:14 UTC. I have posted csv and Excel versions of the combined result files on GitHub. The files include the initial orbital state used for the simulations plus other initial state data, along with the impact location and time for each case.

We can’t have perfect knowledge about the initial orbital state of Orion. These simulations represent a set of initial conditions that vary randomly around my best guess at the nominal state, allowing us to get a reasonable picture of the possible outcomes for Orion given the uncertainties. What is exciting about the results is that the simulated impacts are concentrated in four “high terrain” areas of the Moon. These are the same four impact areas I found earlier with a smaller set of simulations. That’s good! The search area didn’t expand even though we have a larger database.

Figure 1: Impacts from the new database superimposed on a map of the Moon. There are over 350 simulated impacts, all striking the surface within an hour of the target event on May 29th, 1972.

Figure 1 shows the impacts superimposed on a map of the Moon. You can see that each impact cluster is in a place where the terrain is higher…mostly along the ridges surrounding craters. Again, this makes sense: as the orbit destabilizes, the spacecraft is on a flat trajectory at its low point, and it will strike the first piece of high ground it encounters. Overall the possible locations for Orion’s final impact seem pretty well constrained.

Could we tighten things up even more? In looking deeper at the data, it appears that we can. In the result files mentioned above, one extra parameter included for each parameter set is Orion’s initial inclination. Using this data, we can look for any correspondence between inclination and impact point, as plotted in Figure 2. Lo and behold, there is a pattern! The impact longitudes cluster into bands depending on the initial inclination. If we could determine the inclination more precisely, we could focus in on one or two of the clusters.

Figure 2: Orion's Impact Longitude versus Initial Inclination. All the simulations close to the nominal inclination value result in impacts near 104.3° East longitude. This leads to a very small area to search for Orion's impact crater.

As it happens, we can get a very good guess at Orion’s initial inclination, thanks to the Metric Camera database. Prior to casting off Orion, the Apollo 16 crew ran a camera pass, exposing a 70 mm film picture of the Moon’s surface every 10 seconds. Meanwhile another camera took simultaneous pictures of reference stars, so as to know exactly which way the mapping camera was pointing for each shot. This allowed NASA to determine the latitude and longitude of each picture with great precision, which works back to the latitude/longitude of the spacecraft. 

Inclination means how much the orbit is tilted away from the equator, so if we look at all the pictures and find the one that is farthest north or south of the Moon’s equator, that tells us the inclination. It turns out that during revolution 60, a few hours prior to when Orion was jettisoned, there was a mapping camera pass, and we can see from the image database that image AS16-M-2828 was the south-most picture in the run, taken from a point above 10.55 °S. Therefore, the orbit was tilted 10.55 degrees away from the Moon’s equator. Since the orbit was “retrograde”, or against the Moon’s rotation, we reference the inclination to 180°, so it is expressed as 180-10.55 = 169.45°.

Take a look at Figure 2 again. If we limit the inclination values from 169.4° to 169.5° All the impact longitudes are in a narrow band around 104.3°. Wow! That gives us a very small area to look for Orion. Figure 3 is a plot of the impacts from this narrow inclination range. They are clustered within +/- 0.1 degrees in both latitude and longitude. That translates to a square-ish area about 6 km on each side.

Figure 3: A plot of impact locations after applying the inclination constraint. This is an area roughly 6 km on a side. Based on all the evidence, this seems to be the most likely area where Orion struck the Moon in 1972.

To give a sense of scale, Figure 4 compares this impact area to a part of Pasadena, California that is similar in size. The California Institute of Technology is at the lower right corner and the Jet Propulsion Laboratory is at the upper left. The Rose Bowl stadium, along the left about 1/3 of the way from the bottom, gives a sense for the scale of the craters.

Figure 4. Comparison of the impact area to a section of Pasadena, California.

I'm really surprised at how far this analysis has come. When I started, I was hoping that perhaps one of those Mapping Camera pictures should show the impact area BEFORE impact, making it possible to compare with modern images, and perhaps identify any "new" crater. It turns out that isn't feasible. None of the pictures from the mission provide the needed coverage. Given the relatively small size of the area I have identified, perhaps an exhaustive search may turn up some craters or features of interest? 

I have been very impressed by the work of Dr. Phil Stooke, who has been able to identify Lunar Module impact locations for Apollo 12 and Apollo 15, among other notable finds. Perhaps, with the above analysis as a starting point, Dr. Stooke or others might be able to locate the final resting place of Orion someday. 


Sunday, April 24, 2022

Closing The Loop

In my last post I showed that there was a lunar seismic event on May 29th, 1972 that seems likely to have been caused by the impact of the Apollo 16 Lunar Module Orion. Knowing the time of this event is an extremely valuable clue to help locate the point of impact. I showed in an earlier post that the impact locations of a randomized set of simulations varied with time, shifting gradually westward on the Moon for later impact times. If we have a target impact time, we can run more trials, and look for impacts at the right time. Then we can check the area where these occur…and hopefully the area is small enough to make a visual search practical. 

There is a problem with this "shotgun" strategy though. If we generate the trials randomly the impact times with be spread out over days. Only a very small fraction of the runs will happen to hit the Moon around the desired time. Even though each simulation completes in just 8 minutes, it would take thousands of trials to build up a good database of timely impacts. We need a better way.

In looking at the data from the first trials, there is a pattern which might offer a way forward. Each simulation starts with six numbers that represent the initial state of Orion’s orbit. The numbers represent the position (latitude, longitude, and altitude) and velocity (speed and direction) of the spacecraft when it was jettisoned. To generate a set of simulations, each of these six parameters is perturbed randomly. The hope is that the random variations will make up for any errors of precision Orion’s initial state. Hopefully all the variation covers the true initial state. In looking over the six input variables, and comparing to the results, an interesting pattern emerges. 

Figure 1: Impact Date versus initial VMAG

Figure 1 is a plot of the speed parameter, VMAG, versus the resulting simulated impact date. Each dot in the figure represents one simulation run.  What is interesting is the trend in the data, as summarized by the dotted trend line. Simulations resulting in an earlier impact had, on average, smaller VMAG values, and those resulting in later impact had larger VMAG values. According to the trend line, on average a change in VMAG of just 0.000694 km/sec resulted in a one-day change in the impact. That’s 69 cm/sec, for a parameter that is in the range of 1.6 km/second. So a very slight nudge, less that 0.05%, leads to in a one-day shift in the impact date.

Therefore, the strategy is to first run a randomized set of simulations. Then calculate the number of days that the resulting impact “missed” the desired target impact time. Multiply this error by 69 cm/second, and add this “nudge” factor to the initial VMAG value, to generate a new VMAG value. Then re-run the simulation with the new VMAG value. By using the outcome to feed back into the initial conditions, we are "closing the loop". Let's give it a try. 

Figure 2: Impacts converging on the desired time after several rounds of VMAG nudging

Figure 2 shows the results using this technique. On the left side, after the initial run, the impact times range from 2 days early to 4 days late compared to the target time. For each case, I calculate the “nudge” value, update VMAG, and run the simulations again. After one round of this nudging, the results are much more concentrated around the target date. Everything is within +/-1 day of the target. Now I can repeat the process a second time, again adjusting the VMAG values by ~69 cm/sec per day of error. Since the errors are fractions of a day, the nudges are proportionally smaller. After two rounds, I have a large set of simulations which are impacting around the desired time. Voila...it’s working well!

Isn’t this cheating? We started by generating random variations, but now we are selectively adjusting one of those values. VMAG is no longer random. That is true, but there is still value in this technique. Take a look at the progression of VMAG values in the trials, shown in Figure 3. (These are sorted from lowest to highest initial values.) The values for VMAG vary randomly with a total of 6 meters/sec variation around the nominal value. (This is a very generous variation, given that NASA said in 1972 that the doppler tracking enabled them to measure the spacecraft speed to within 0.5 feet/sec.) After two rounds of nudging, the variation in VMAG is less than 3 meters/sec. Focusing on the desired impact date has compressed the variation of VMAG, but we are still testing a generous set of its possible values. And we still have fully random variation of the other five parameters.

Figure 3: Initial VMAG values (blue) and final values (red) after nudging

OK, we are able to focus the impact times, but what about the impact locations? As hoped, as the impacts begin to cluster more tightly around the desired time on May 29th, they also begin to cluster more tightly on the surface of the Moon. As I showed in a previous post, initially the impacts are spread across a wide band of longitudes, from 62° E to 126° E. That band is over 1000 miles wide! Figure 4 shows the results after nudging towards the target impact time. The impacts are now clustered around a few prominent terrain features near 10° N and 105° E. Although this is still quite a large area, we are making progress. The total search area is greatly reduced, especially since the impacts are concentrated primarily along crater rims. I'm beginning to have hope that Orion's final impact crater might be found. 

Figure 4: Locations for simulated impacts that occur near the time of the May 29th seismic event

Perhaps there are other clues we can use to further constrain the impact area...next time. Meanwhile, happy hunting!


Sunday, March 20, 2022

Orion's Time of Impact

In a previous post we found that the Apollo 16 Lunar Module “Orion” probably hit the Moon in late May, 1972. It would be great if there was a database that could help us to pin down the time of impact more precisely, which would help to narrow the area of the impact. It turns out there is such a database, which is the seismic data collected from the Moon by the Apollo Passive Seismic Experiment, the PSE. The PSE probably recorded the impact of Orion, but in 1972 the impact would not have been recognized as that of a Lunar Module. With our modern simulations could we pick out a seismic event from all that data? Let’s check it out.

Figure 1: One of the PSE detectors, in the foreground, as deployed on the Moon. The Apollo 11 detector overheated after a few weeks, so the later ones were insulated with a reflective blanket.


Seismometers were placed on the lunar surface by each of the Apollo missions up to and including Apollo 16. The one from the Apollo 11 mission failed after two months, but in May of 1972 all of the other stations, from Apollo 12, 14, 15, and 16 were operating and their data was being continuously recorded back on Earth. (Lots of data, which consumed thousands of the open reel magnetic tapes used to record it at the time.) Over the next decade the data was analyzed, and a catalog of lunar seismic events was published in 1981. This catalog is available online today, in its coded format, along with an explanation of the coding. The analysis showed that the events had different characteristics, and could be grouped into various categories such as deep moonquakes, shallow moonquakes, and meteoroid impacts. 

One of the most unexpected features of the Moon became apparent as soon as the first seismic data began streaming back to Earth. To the surprise of the scientists, seismic events on the Moon lasted much longer than anticipated. Unlike Earth, where water and other viscous material dissipates seismic energy, the Moon is very brittle and completely dry, so there is much less absorption of the waves as they propagate around. One of the scientists went so far as to say that the Moon “rings like a bell”. Of course, this shouldn’t be taken literally…but moonquakes definitely reverberate much longer than earthquakes.

One interesting category of seismic event are those from the intentional impacts of Apollo hardware. There are 4 known events from discarded Lunar Modules, as shown in the table below. The table shows the date, the time when the seismic signals started and ended, and the peak amplitudes at each of the 4 PSE stations. The first is the Apollo 12 Lunar Module ascent stage, which crashed near that landing site in November, 1969 right after the placement of the A12 PSE station. Of course at that time the A12 station was the only one operating. For each subsequent LM impact, another station was operating. Also notice that the amplitudes tend to be largest at the newest station. That’s because the LM’s were usually crashed near the most recent landing site. This page lists the impact locations of these Lunar Modules, along with other impact locations. No PSE station was added for Apollo 17, so that impact was more distant from the stations. Notice that in all cases the vibrations lasted for more than one hour. The A12 impact lasted 65 minutes, even though it had a shallow impact angle. The A17 LM impact waves lasted over two hours.

Figure 2: PSE event data for the 4 known Lunar Module impacts

The impact of Orion would not have been recognized as an LM event in 1972. There was no tracking of the stage once its batteries died, and the modeling and computing at the time was insufficient to predict when Orion’s orbit would destabilize. Orion’s impact would have looked like a meteoroid event. Given that we see from simulations that Orion likely struck the Moon at the end of May, 1972, are there any meteoroid impact events in the catalog that could represent the demise of Orion?

Below is a list of all the catalogued meteoroid (type ‘C’) impact events between May 23rd and June 6th of 1972. Remember that in our first set of simulations, all the impacts occurred between May 28th and June 3rd. Notice that there is only one meteoroid event in that period, on May 29th. That is a very interesting event, given that it is right in the middle of the range of the trials. Could this be the impact of Orion? It lasts 98 minutes, and generates substantial amplitudes at all the stations. There is also a cryptic comment: “DIST”.

Figure 3: All the PSE meteoroid impact events from around the end of May, 1972. The May 29 event seems particularly interesting as a possible record of Orion's impact.

In searching the web for PSE data, one name comes up again and again: Dr. Yosio Nakamura. He was obviously deeply involved in analyzing all the data, as his name appears on many of the publications. Even the catalog of PSE events is tied to his name. As this article explains, he was intimately involved in the PSE project from beginning to end. He helped to capture and analyze the first data from Apollo 11, and was back in Houston for Apollo 12. He also helped to preserve the data in the 1990’s, by arranging for all the raw data of over 12,000 reels (!) of the original tapes to be transferred to more modern, and more compact Exabyte cassettes. Today he is an emeritus professor at the University of Texas in Austin.

I contacted Dr. Nakamura, explaining my interest in the meteroid event of May 29, 1972, and he was kind enough to reply back. Not only that, but he was also kind enough to visit the facility where the raw data is stored, examine the event records, and perform some analysis. Here is what he was able to say: 

“Two things are clear: (1) The recorded amplitude at the Apollo 16 station is definitely larger than that at the Apollo 14 station, even considering that the Apollo 14 station tends to record amplitude slightly larger than that at the Apollo 16 station because of local site effect.  This means that the impact location is east of the seismic network.  (2) Seismic signals are detected at all four stations.  This means that the impact location is not far into the far side of the moon, because if it were, the seismic signals would be significantly reduced because of the high shear-wave attenuation in the lower mantle.”

These facts do fit with the simulation results for Orion, which showed it impacting between 70 and 125 degrees East longitude. Was there any way from the timing of the signals to triangulate the impact location? 

“Because the onsets of the seismic signals of the {May 29} event are too weak to be read precisely to compute the impact location, I have been looking at the amplitudes of their signals instead. One of the attached files shows plots of the catalogued amplitudes vs. distance of the {May 29} event with suggested impact locations compared with those of the other LM impacts. In the top figure, the catalogued amplitudes are plotted, while in the bottom figure, catalogued amplitudes are adjusted, or compensated, for the difference in detection sensitivity among stations."

Below is Professor Nakamura's "bottom" figure, with the compensated amplitudes

Figure 4: Nakamura's plot of compensated PSE amplitudes versus distance for the known LM impacts, as well as for theoretical Orion impacts at two longitudes. This is the "bottom plot" that he refers to.

"One thing that is clear from the bottom plot is that there are some differences in the amount of seismic energy radiated from LM impacts:  Similar amount of energies were radiated from 14 LM and 15 LM impacts, while 12 LM impact radiated less energy, producing about 1/2 of the first two in seismic amplitudes and 17LM impact radiated more energy, producing about 3 times more amplitudes than the first two.  This happened even with nearly equal impact energies (3.14-3.43 x 10^9 J) and impact angles (3.2°-4.9° from horizontal) (NASA TM X-58131, Table 4-111)."

"Considering this range of observed amplitudes, the amplitudes and the distance ranges of the assumed impact location of the {May29} event are consistent with those for a LM impact.  If anything, it radiated more energy than the 14 and 15 LM impacts but similar to the 17 LM impact, and/or it may have been closer to the seismic network than assumed.  One thing we cannot do with this set of amplitude data is to pinpoint the impact location within say better than ~30° or `~1000 km or so in any direction.”

He then adds a final valuable clue…

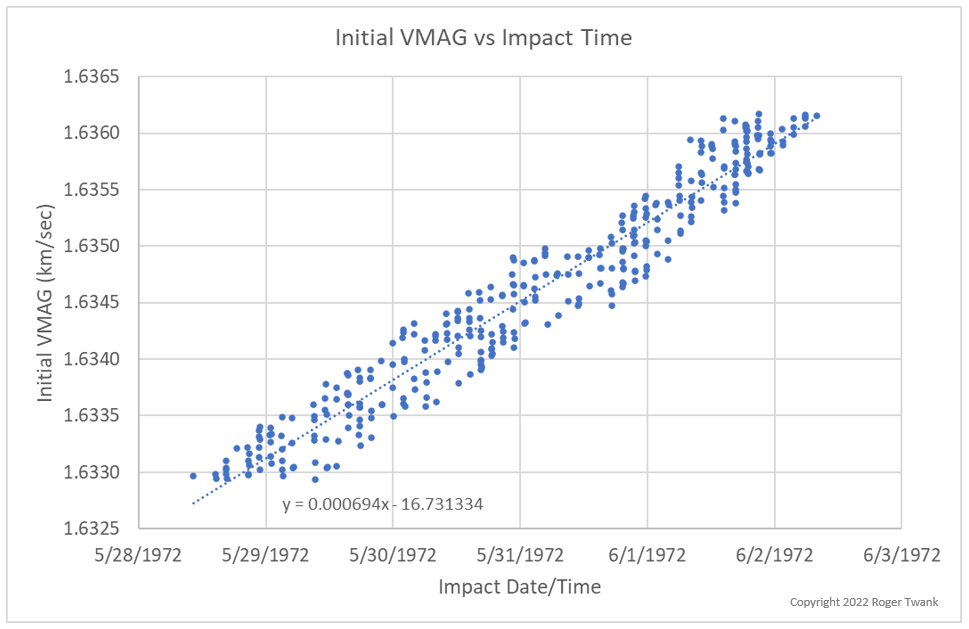
“I estimate the time of this impact to be about 7 minutes before the cataloged time 21:22 UTC, or about 21:15 UTC, with an uncertainty of ±2 min. This is based on an impact distance of 3000±1000 km from the nearest station.”  [See the comment below.]

Wow! The simulations pointed us to one of the events in the PSE catalog. This event seems to fit well with what we know so far about Orion's orbit. The event is "consistent with those for a LM impact" at the range of impact locations we simulated, and if it's right, we now know fairly precisely the time of Orion's impact. With that information, we should be able to go back and refine the simulations, focusing on those that result in impacts at the stated time. That should GREATLY narrow down the area where Orion could have impacted. Could we actually locate the impact crater? 

I want to express my gratitude to Professor Nakamura for his kind assistance. I feel very fortunate to have benefitted from his expertise. Thank you!

Sunday, February 27, 2022

More on Orion


Based on an initial simulation it seems that the Apollo 16 Lunar Module Orion, abandoned in lunar orbit in 1972, smashed into the surface of the Moon about 5 weeks later. Would it be possible to locate the impact crater? Let’s get the best estimate we can for the initial orbit, run a randomized series of simulations, to try to narrow the search.

In previous investigations I have relied on the Mission Reports to provide the initial orbit state. For Apollo 16, the record is much richer. In particular, there are orbital state vectors (i.e., position and velocity information) for each of the hundreds of photographs taken by the “Metric Camera” experiment, which was in the science bay of the Command Module. In particular, this file has all the state information for every photo taken during the mission. 

A subset of these is of special interest…those from the “Rev 60” and “Rev 63” mapping passes. This refers to the fact that the photos were all taken during the 60th or 63rd revolution of the Apollo 16 CSM around the Moon. By this time John Young and Charlie Duke had returned from the lunar surface, and rendezvous and docking took place during Rev 53.  The LM was jettisoned during Rev 62, so the Rev 60 and 63 mapping passes bracket the last known position of Orion.

I grabbed a set of the Rev 60 data points and adjusted a simulation so that I fit them as closely as I could. Though trial and error I found that I could match them to within +/- 20 meters of altitude. Based on the documentation, this original state vector data was fitted in 1972 to a solution for the orbit that was generated using the best gravity model and ephemeris available at that time. I’m using a better gravity model and a modern ephemeris, so I’m not surprised that I don’t match up exactly. A residual error of +/- 20 meters seems pretty good.

Then I did the same thing for Rev 63 data points to get another estimate of the CSM orbit after the LM was jettisoned. With these estimates for the orbit, I can propagate to the moment of jettison and compare to the values published in the Mission report. (The simulator can run “backwards”, so it can reverse propagate from Rev 63 just as easily as it propagates forward from Rev 60.) The results are shown in Figure 1.

Figure 1: Comparing Orion's initial state, from 3 different sources.

Not bad! The positions are all within 0.5 km of each other, and the velocities match up well. The velocity difference when working backwards from Rev 63 is slower than the others, which is expected…it accounts for the ~2 ft/sec separation maneuver performed after Orion was jettisoned. 

The next step is to compensate the horizontal flight path angle, i.e., the HFPA. Orion was jettisoned “upwards”, away from the Moon, at about 2 f.p.s. and so this slightly increases the angle that it is moving relative to the local horizontal direction. It works out to be about 0.021 degrees, so adding this to the HFPA gives 0.42 degrees.

Now we can generate random sets of initial conditions that are similar to these and see where the impacts occur. I adopted the "Rev 60" state as the “nominal” case, and then varied randomly around those values. I generated a total of 350 randomized parameter sets and ran them all. Each run takes about 8 minutes to simulate, and I have a python script that automatically runs then one after another, so the whole batch completes in about 2 days. Each run produces a ground track file, and I post-process all of these as a batch to extract the impact locations.

What are the results? All 350 simulated impacts occurred between May 28th, and June 2nd of 1972. That's a fairly tight cluster. Looking deeper, there are some things that were expected, and other things I found surprising. Figure 2 is a plot of the impact date versus impact longitude for all 350 trials. The first thing to notice is the overall trend. Impacts that occur earlier are farther to the East, and the later ones are progressively farther West. This is to be expected, because the Moon is rotating Westward under the orbit as it destabilizes. (The impacts are also focused in a narrow band of latitudes, from 8.5 to 10 °N, which is under the plane of the orbit.)

Figure 2: Impact Longitude versus Date. Later impacts occur farther West.

Then notice the next trend…the impact longitudes occur in bands. For instance, notice that near the end of May 29th, the impacts are mostly around 104 °E, and then during May 30th they shift and are clustered around 99 °E. This clustering also isn’t surprising…it’s a consequence of the lunar terrain. The impacts always occur on the highest nearby terrain as the orbit drops lower and lower, so these impact clusters correspond to tall features of the Moon’s surface. Figure 3 below shows the latitude and longitude of the impacts (as red dots) superimposed on a map of the Moon, and it’s obvious that the dots are clustered around craters and mountainous areas. (At this scale it's hard to see that there are a lot of overlapping dots.)

Figure 3: Impact locations superimposed on a map of the Moon.

One thing I did find surprising is that the impact times are also quantized…they tend to be concentrated into buckets separated by about two hours. A lot of the individual impacts are overlapping on the plot in Figure 1 above, so it’s easier to see this time quantization if we zoom in on a few impacts like in Figure 4 below. Now you can see that there are 6 trials that resulted in impacts around 20:00 hours (10 PM) on May 29th, then 3 others around 22:00, then another 4 around Midnight, and so forth. On the one hand, the two-hour separation makes sense. If the spacecraft barely misses a mountain on one pass, it is likely to be lower, and therefore to impact that mountain on the next pass, which will come two hours later. (The time to complete one revolution is about two hours.) But all the trials have slightly different orbits and slightly different periods, so after 5 weeks orbiting the Moon all those virtual spacecraft in all those trials should have spread out, like race cars around an oval track in a long race.  

Figure 4: Details of impacts occurring around midnight on May 29th, showing how the impacts are occurring in clusters separated by about 2 hours.

It turns out that they do spread out, but the ones that are in similar orbits, with similar orbital periods, tend to impact around the same time. So, the impact times are sorted by orbital period. I would not have guessed this, but in hindsight it also makes sense. It turns out that the impact times depend on the energy of the initial orbit. Lower energy results in earlier impact, and vice versa. The energy of the orbit also determines the orbital period. Therefore, impacts that occur around the same time, which started with similar energy, also have the same period, resulting in the clustering of the impact times. Figure 5 below shows a plot of initial orbit altitude versus impact time, and there is a clear relationship. (The altitude plotted is the average of the initial apolune and perilune altitudes, which directly ties to the orbital energy.)

Figure 5: The time of impact correlates to the initial energy of the orbit, which also relates to the orbital period. This explains the clustering of the impact times.

What have we learned so far about Orion? It seems clear that Orion must have impacted the Moon sometime around the end of May of 1972, about 5 weeks after it was jettisoned. Longitude of the impact is probably between 70 and 120 °E. The impact location is likely to be on a mountain or crater wall, along a narrow track between 8 and 11 °N Latitude, and there seem to be just a handful of locations where the impacts are concentrated. Could we actually locate the impact crater? Although we have narrowed down the search considerably, we are still talking about huge areas of the Moon. (One degree of longitude along the Moon's equator is about 20 miles.) In my next post we'll dig into some other sources of data to see if there are any clues that could be helpful to narrow the search even more.


Monday, February 21, 2022

What About Orion?

As I write this, the 50th anniversary of the Apollo 16 mission is a few months away. Like all of the later Apollo missions, the plan for the ascent stage of the Lunar Module “Orion”, after it returned the astronauts to orbit, was to intentionally crash it into the lunar surface. This would generate seismic waves that would reveal the inner structure of the Moon by way of the seismometers left on the surface by the astronauts. These intentional impacts were done for the Apollo 12, 14, 15, and 17 missions. But something went wrong during Apollo 16, and the LM “Orion” stage did not hold its attitude (orientation) after it was jettisoned. With no way to control which way it was pointing, there was no safe way to command its engine to fire. It was abandoned in orbit, left to drift under the forces of lunar gravity, and no one knows what happened to it. Let’s turn our attention to Orion and see if we can shed some light on what became of this vessel.

If you’ve read my previous posts, you know the drill by now. We can get the initial conditions for the stage orbit from the Mission Report. We use GMAT and a high-fidelity gravity map to simulate the spacecraft. We record the “perilune”, the lowest point, for each revolution, and watch to see how close the stage comes to the surface over time. The orbital period is about two hours, as usual for low lunar orbits, so we get about 12 perilune points per day. GMAT simulates one year of spacecraft time in about an hour (on my computer) so we get a month of simulated orbit data every 5 minutes or so. The simulator doesn’t know about terrain, but we can tell the simulator to stop once the perilune point is a few km below the mean radius…at a point where an impact would surely already have occurred.

Figure 1: Simulated Perilune Altitude for Orion

Using the “nominal” initial conditions from the Mission Report, I get a script like this one. And the resulting perilune sequence is shown in Figure 1. It looks like Orion didn’t remain in orbit very long. By the end of May 1972, the spacecraft is already zero km above the Moon’s mean radius. A day or two later the perilune has dropped to 5 km below mean radius. Whack!

If you read my earlier post about “PFS-2” the Apollo 16 subsatellite, you might notice something interesting. The perilune sequence looks very similar, and PFS-2 is known to have also impacted the Moon near the end of May. Did I use the wrong script? No, actually the similar result is not surprising, when you consider the release of each object. Figure 2 shows an excerpt from the Mission Report, and details the sequence. After Orion was jettisoned, the astronauts performed a small “separation burn”, changing their velocity by just 2 feet per second. Then an hour later they released PFS-2. So, Orion was drifting along nearby when PFS-2 was jettisoned, and the two objects were in very similar orbits. They were in almost the same plane, and at almost the same altitude and speed. In hindsight it is not surprising that both orbits destabilize in a similar fashion.

Figure2: This excerpt from the Mission Report shows how the PFS-2 subsatellite was launched soon after Orion was jettisoned. Both events are during the 62nd revolution around the Moon, and just one small "CSM separation" maneuver was performed in between. Thus Orion and PFS-2 were in very similar orbits. Similar impact dates should not be surprising.

Where does Orion impact the Moon in this nominal case? Using the analysis method I describe here, Orion strikes the Moon at 77.5E, 8.16N at 8:14 on June 1st, 1972. Again, that is very similar to the impact time and point reported by NASA for PFS-2. The time is day or so later, and the impact is farther West. This simulation runs fairly quickly, completing in under 10 minutes on my computer. That means it will be quick to run a lot of variations of the initial conditions, so as to understand how much uncertainty there is in the result. I'll post those results later.

There is another important source of data we can look to for clues about Orion: those seismometers left on the surface that I mentioned above. In May of 1972 NASA had 4 stations operating, at the landing sites of Apollo 12, 14, 15, and 16. (The station at the Apollo 11 site stopped working late in August of 1969.) The data from all 4 stations was monitored and recorded continuously. The impact of Orion, weighing 5,000 pounds and moving at a mile per second, should have registered as a meteoroid strike, so we’ll be able to look for seismic events that might help to pinpoint the time of impact.

And then, in addition to the Mission Report, there are other clues we can use to help understand Orion’s initial orbit. During the later Apollo Missions, including Apollo 16, an extensive set of photographs were taken from lunar orbit by Panoramic and Mapping Cameras operating in the science bay of the Service Module. Each of these photos has an associated blob of data about the location of the spacecraft when it was taken. Hopefully this data can be used to further refine the initial conditions. And then if we get very lucky, these photographs might contain a “before” view of the area where Orion hit the surface, making it easier to identify any “new” crater.

Okay, so we have a large spacecraft that struck the Moon within weeks of its last sighting. We have a number of great data sources that we can search for clues. We have photos of the surface taken before the impact, and of course we have the high-resolution images captured by LRO and other lunar satellites. Perhaps we can identify the impact crater of Orion in time for the 50th anniversary of the mission. The game is on!